 Trucking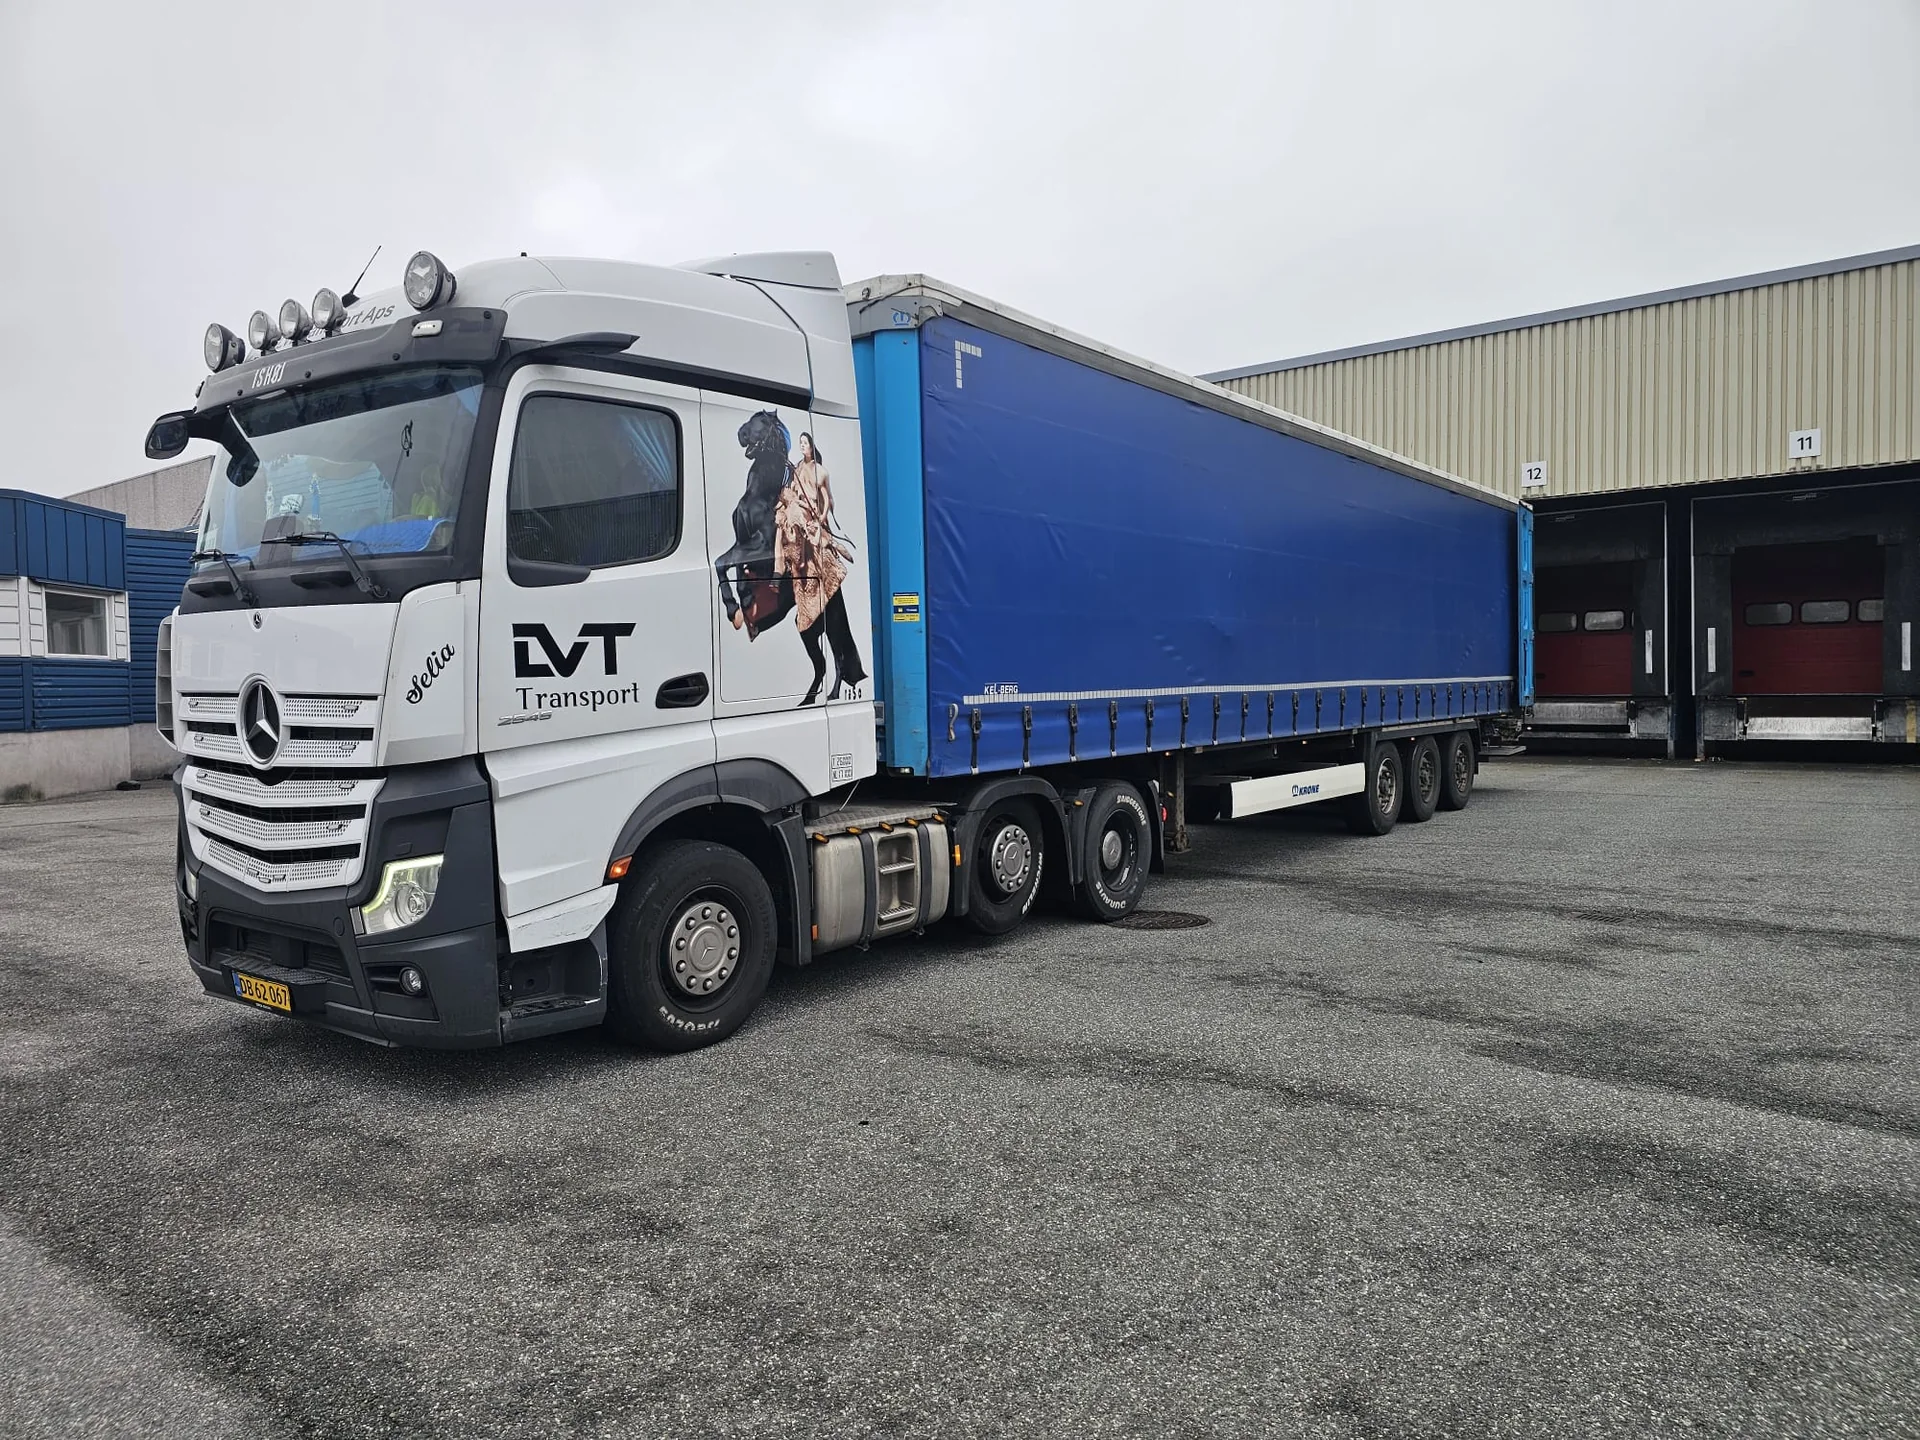
CO₂
CO₂ for your shipments – how we calculate it
Many buyers need to document transport emissions. Here is our method – open and without embellishment.
The method
Actual figures wherever we have them
We use the best figures we have: actual figures from our own trucks – and otherwise an estimate that is clearly shown as an estimate.
- 1
Figures from the truck
When one of our own trucks has driven the route, we use the actual kilometres and emissions from the truck's GPS system, split across the bookings on the trip.
- 2
Before the trip: an estimate – and we say so
Until the route has been driven, we use the planned distance and a fixed factor per kilometre. The figures are marked as estimates.
- 3
Other transport modes
For ocean, air, rail and shipments with partners we use the cargo weight × the distance × an indicative factor per tonne-kilometre (see the table).
The factors are indicative, non-certified averages. Actual emissions depend on the truck, load, road and weather, among other things.
The report
Ready for your sustainability report
Per period
See shipments, kilos, kilometres and CO₂e per month, quarter or year in the customer portal.
Per lane and mode
Split by lane and by Trucking and Freight Forwarding, so you can see where the emissions come from.
Download as CSV
Download the figures and use them directly in your own spreadsheets and reports.
Quick request
Get a price for your transport
Enter the essentials here and we will come back with a price – the same day on weekdays.
Lots of details? Use the full form →